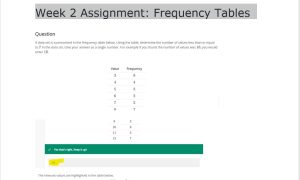
- Question: A data set is summarized in the frequency table below. Using the table, determine the
number of values less than or equal to 5. Give your answer as a single number. For example if you
found the number of values was 19, you would enter 19. - Question: Given the frequency table, how many times does the data value 3 show up in the data
set? - Question: A group of students were surveyed about the number of siblings they have. The
frequencies and relative frequencies of their responses are shown in the below. Complete the
cumulative relative frequency table. - Question: Given the relative frequency table below, which of the following is the corresponding
cumulative relative frequency table? - Question: A group of students were surveyed about the number of books they read last summer.
Their responses are summarized in the frequency table below. How many students responded to
the survey? - Question: 6.The ages of the students in an art class at the community center are listed
below. 9,11,14,14,16,21,24,26,32,33,37,38,38,52,53,55.
Complete the frequency table.1,4,3,5,0,3 - Question: A data set is summarized in the frequency table below. Using the table, determine the
number of values less than or equal to 7 in the data set. Give your answer as a single number. For
example if you found the number of values was 16, you would enter 16. - Question: A data set is summarized in the frequency table below. Using the table, determine the
number of values less than or equal to 6. Give your answer as a single number. For example if you - Question: As the manager of a store, you wish to determine the amount of money that people who
visit this store are willing to spend on impulse buys on products placed near the checkout register.
You sample twenty individuals and records their responses. Construct a frequency table for
grouped data using five classes. 8,18,15,10,29,4,15,2,4,9,16,14,13,8,25,25,27,1,15,24 - Question: As a member of a marketing team, you have been tasked with determining the number
of DVDs that people have rented over the past six months. Their responses are summarized in the
relative frequency table below.
What is the cumulative relative frequency of customers who rent 27 or fewer DVDs? - Question: Given the relative frequency table below, which of the following is the corresponding
cumulative relative frequency table? - Question: Several executives were asked how many suits they own. The results are tabulated
in the following frequency table. - Question: Describe the shape of the given histogram.
- Question: Several people were asked to report the number of hours of sleep they average per
night. The results are shown in the histogram below. How many of those people average
between 4.5 and 6.5 hours of sleep per night? - Question: Describe the shape of the given histogram.
- Question: The histogram below represents the prices of digital SLR camera models at a store.
Describe the shape of the distribution. - Question: Given the following histogram for a set of data, how many values in the data set are
between 5.5 and 8.5? - Question: Describe the shape of the given histogram.
- Question: A professor gave students a test, and the distribution of the scores of the students is
shown in the histogram below. What shape does the distribution have? - Question: The author of a book wants to know what price his book is being sold for. He gets the
price from all the bookstores in a city and creates a histogram of the results. What is the shape of
the distribution? - Question: Given the following histogram for a set of data, how many values in the data set are
between 7.5 and 9.5? ….. Provide your answer below: - Question: Gail is a car salesperson, who keeps track of her sales over time. The line graph below
shows the data for the number of cars she sells per week ….. her sales 8? Do not include the unit
in your answer. Provide your answer below: - Question: Porter is keeping track of the total number of books he has read over time. The line
graph below …. How many books did Porter read from month 2 to 5? Do not include the unit in
your answer. Provide your answer below: - Question: The bar graph below shows the number of men and women in different classes. How
many total students are in the computer science class? Do not include the units in your answer. - Question: The bar graph below shows the number of men and women in different classes. A sideby-side bar graph has a horizontal axis labeled Classes with groups Chemistry and Law and a
vertical axis labeled Students from 0 to 14 in increments of 2. There are two vertical bars over
each horizontal axis label, with the bar on the left representing men and the bar on the right
representing women. The heights of the bars are as follows, with the horizontal axis label listed
first and the bar heights listed second from left to right:
ANSWER
………..please click the icon below to purchase full solution at $10